

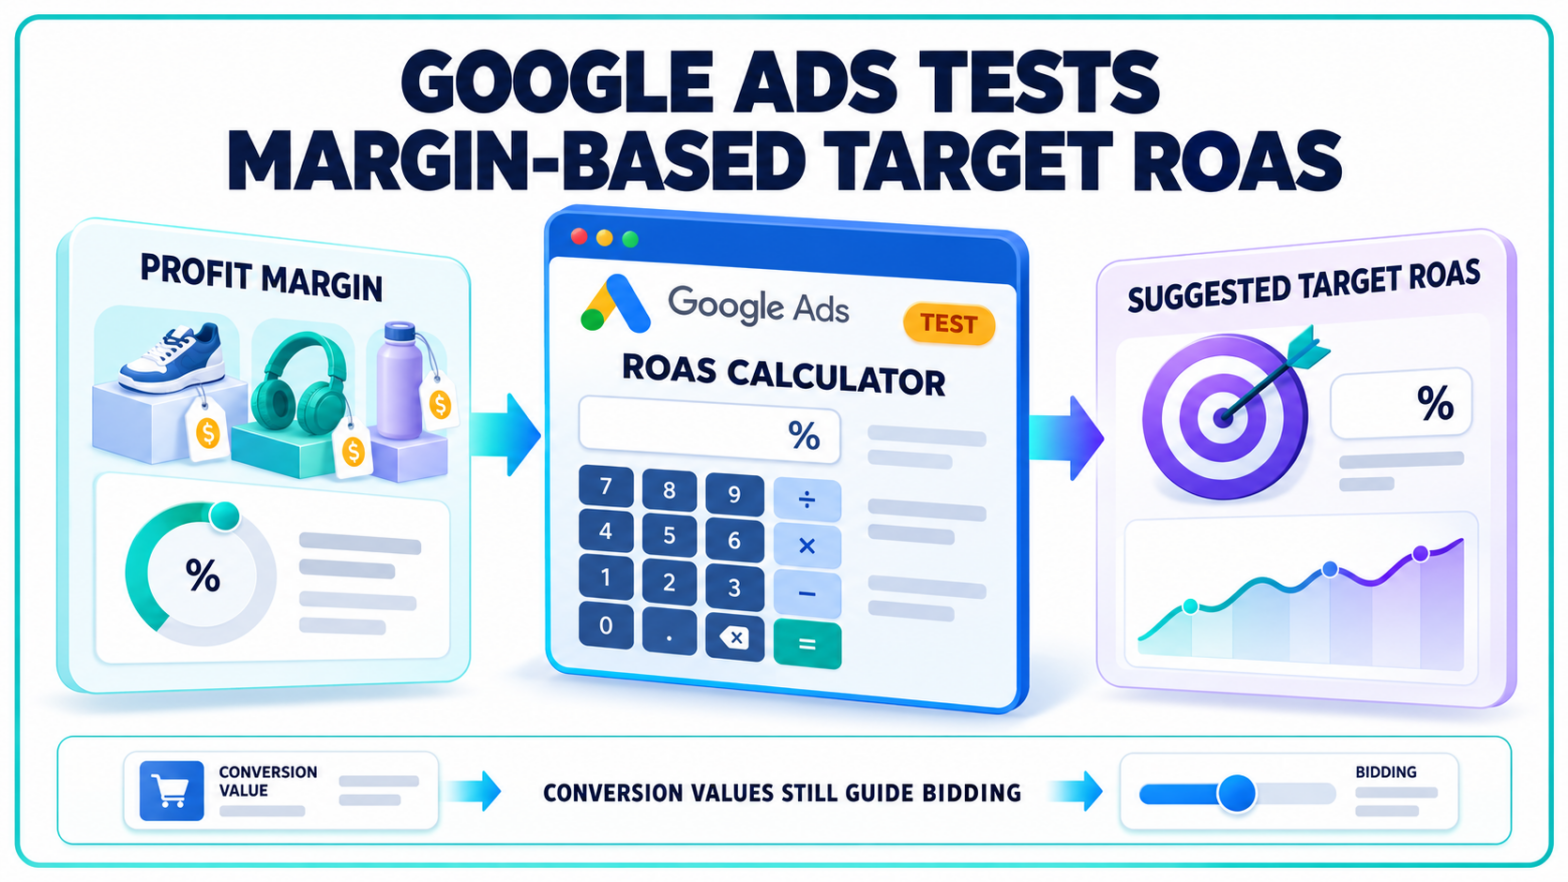
Revenue can rise while a campaign loses money. A Target ROAS calculator being tested in Google Ads brings an advertiser’s profit margin into the decision about how much return a campaign needs to generate.
The feature asks for the campaign’s average profit margin excluding ad spend and uses that input to calculate a suggested return-on-ad-spend target. For businesses selling products with different costs, the central question is whether the target reflects the money left from a sale.
A Target ROAS Calculator Starts With the Cost of Selling
The calculator was spotted by paid search specialist Arpan Banerjee and surfaced publicly on October 6. It is being reported as a test, rather than a confirmed release across all advertiser accounts.
The reported input is an average campaign margin before advertising costs. That differs from entering the desired revenue return directly into the bidding settings: the advertiser supplies a business economics figure, and the calculator translates it into a suggested target.
Retailers and ecommerce advertisers have an immediate reason to distinguish those figures. Two campaigns can report the same revenue and ad spend while leaving different amounts available to cover advertising, depending on the cost of the products sold.
The test also sits alongside a familiar Google Ads workflow. Google’s Target ROAS documentation describes recommendations based on recent achieved ROAS. Historical performance describes what a campaign has delivered. A margin calculation addresses what the business needs those sales to support.
Neither figure answers both questions.
A 400 Percent Return Can Still Leave a Loss
The economics are easiest to see in a simplified example, separate from any claim about the calculator’s exact implementation.
Assume a retailer receives $100 in sales and retains $20 after all costs included in its pre-ad margin calculation. Its margin is 20%. If the advertising needed to generate those sales costs $20, the retailer has used the entire remaining amount.
Revenue divided by advertising cost is five, equivalent to 500% ROAS. Under those assumptions, that is the break-even return.
At 400% ROAS, the same $100 in revenue requires $25 in advertising. The campaign would be $5 short after the costs already included in the margin calculation. A report showing four dollars of sales for each advertising dollar would still describe a loss.
The simplified break-even formula is one divided by the pre-ad margin expressed as a decimal. A 40% margin produces a 2.5-times return, or 250%.
The definition of margin matters throughout. Costs left outside the input remain outside that calculation. Google’s separate guidance on calculating returns includes advertising costs and business overhead when assessing profit.
Google Ads Bidding Still Follows the Values It Receives
A margin-informed target and profit-valued conversions are different parts of campaign measurement.
If an advertiser reports purchase revenue as conversion value, Target ROAS still measures that reported value against advertising spend. Calculating the target from a margin does not, by itself, replace each purchase’s revenue with its profit.
Google’s value-based bidding guidance allows advertisers to define values around revenue, profit or other business outcomes. That choice is made through the measurement setup and the values supplied to Google Ads.
Consider two hypothetical $100 orders. One leaves $20 before advertising; the other leaves $50. If both are reported as $100 conversions, the value signal does not express their different margins. A campaign-wide average may inform the return target, but it does not provide that order-level distinction.
The existing separation between target setting and value-based bidding remains relevant. Google documents Maximize conversion value as pursuing the most reported value within the budget, while Target ROAS adds an average return objective.
The calculator concerns the number attached to that objective. The underlying measurement determines what the return represents.
An Average Profit Margin Can Hide a Changing Product Mix
A campaign selling a broad catalogue needs an average that reflects the sales it generates. A simple average of product margin percentages can differ from the margin on actual revenue when customers buy more of one product than another.
In a hypothetical campaign, $900 of revenue at a 20% margin leaves $180 before ads. Another $100 at a 60% margin leaves $60. Combined, the campaign retains $240 from $1,000 of revenue: a 24% margin, rather than the 40% obtained by averaging the two percentages equally.
Discounts and changes in the products purchased can alter that calculation even when the campaign’s revenue stays stable.
Google’s product reporting documentation identifies conversions with cart data as a way to examine what customers bought and identify high-margin transactions. That reporting capability is separate from the calculator test.
For marketers, the practical task is to reconcile the campaign’s margin definition with its reported conversion values and recent performance. Reliable conversion tracking remains necessary; a suggested target cannot correct missing purchase values or an average that describes a different sales mix.
A Calculated Target Is Still an Average Bidding Goal
The output is a target for automated bidding, rather than a guaranteed return on each order. Google says Target ROAS seeks an average return, with individual conversions delivering above or below it.
The platform also warns that an excessively high target can limit traffic. A margin calculation can establish an economic requirement without establishing that the campaign can achieve it at its current volume.
The calculator’s wider availability remains unconfirmed. Its reported campaign-average input also leaves the advertiser responsible for supplying the margin used in the calculation.