
Marketing teams rarely have a shortage of data. The harder problem is getting someone outside the marketing department to understand it.
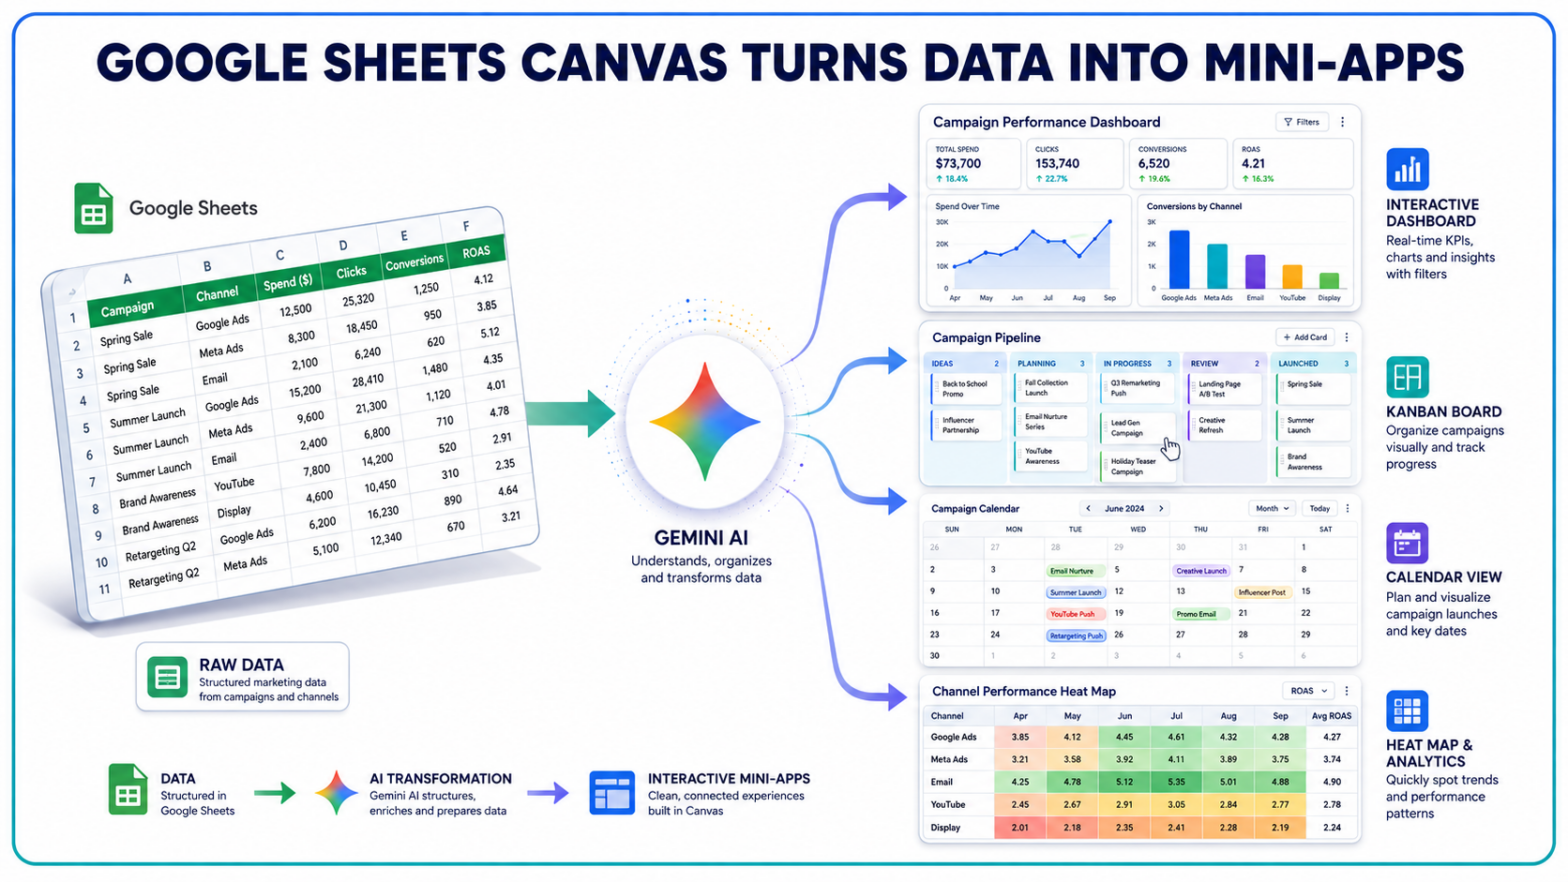
Google is trying to close that gap inside the spreadsheet itself. Sheets canvas, a Gemini-powered feature in Google Sheets, can turn rows and columns into interactive dashboards, Kanban boards, heat maps, calendars and other custom visual interfaces without requiring users to code them from scratch.
For marketers accustomed to building a report in Sheets and then recreating its story somewhere else for executives, clients or sales teams, that changes the role of the spreadsheet. The grid can remain underneath. The audience does not necessarily have to see it.
The Spreadsheet Is Becoming the Presentation Layer
Traditional spreadsheet reporting asks the viewer to do some work.
They have to understand column labels, interpret formulas, move between tabs and figure out which numbers actually matter. A marketing analyst may be perfectly comfortable inside that environment. A CEO trying to understand pipeline movement before a meeting may not be.
Sheets canvas separates the interface from the underlying grid.
Users can ask Gemini to generate a visualization based on the data in a Sheet. Google lists dashboards, heat maps, Kanban boards and custom interactive visualizations among the supported use cases. A canvas can also be used as a gallery view or calendar, including a calendar that plots campaign launch dates.
The difference is more substantial than adding another chart.
Canvas functions as a read-write interface. Someone with edit access can change, add or delete information from the visual interface, and those changes are reflected in the spreadsheet data beneath it. A marketer could move an opportunity through a Kanban-style pipeline, for example, without manually finding the corresponding row and changing its status field.
Google first described Sheets canvas as an alpha capability that creates custom mini-apps directly on top of spreadsheet data, with changes automatically syncing back to the Sheet.
Marketing Dashboards No Longer Have to Start From Scratch
Reporting has already been moving in this direction elsewhere in Google's marketing stack.
Earlier this year, Google introduced Gemini-powered reporting dashboards inside Google Ads, letting advertisers use prompts to generate and adjust visual performance reports. Sheets canvas extends the same broad idea beyond an individual advertising platform.
That matters because many marketing reports are assembled from more than one source.
A Sheet might contain monthly paid media results, CRM pipeline figures, content production data, sales targets or manually imported channel metrics. Once those figures are organized, Canvas can build a more approachable interface over the data rather than requiring every stakeholder to navigate the workbook.
Google's examples extend well beyond conventional charts. A user can ask for a dashboard around pricing or valuation data, convert tasks into a draggable Kanban board or display records as sortable cards. Prompts can also be used after the canvas is generated to alter its presentation.
For marketing operations teams, that opens up reporting formats that previously required more setup than a standard spreadsheet chart.
A campaign calendar can become interactive. A content pipeline can become a Kanban board. Account performance can be presented as a dashboard rather than a collection of tables.
The source remains the Sheet.
Gemini Is Moving From Analyzing Data to Building the Interface
The more important change may be what Gemini is being asked to do.
Google has spent much of 2026 expanding Gemini from an assistant that explains information into a system that creates and operates parts of a workflow. In Sheets, Gemini can already build and edit spreadsheets using natural-language instructions, populate data and work through complex spreadsheet tasks. Google has also been pushing Gemini deeper into advertising through Google Marketing Platform, where AI is increasingly involved in campaign setup, analysis and reporting.
Canvas adds interface generation to that list.
Instead of asking Gemini only to calculate, categorize or summarize the contents of cells, users can tell it how they want those contents represented and interacted with.
That distinction is important for marketing analytics. The bottleneck in reporting is often not producing another calculation. It is converting the calculation into something another person can understand quickly enough to act on.
Google's broader measurement products have been reducing similar friction. GA4, for example, now identifies chatbot referrals through a dedicated AI Assistant channel, while other Google Analytics updates are expanding how reporting data can be accessed and used outside the standard interface.
Sheets canvas addresses the other end of the process: presentation.
The C-Suite Use Case Is Bigger Than Better Charts
Executive reporting is where Canvas may become particularly useful for marketers.
Senior leaders generally do not need every dimension available in an advertising account. They need a clear view of what changed, whether performance is on target and where attention is required.
A raw acquisition spreadsheet may contain hundreds of campaign rows. The executive question could be much simpler: Which channels are above target this month?
A lead-generation workbook may contain individual opportunities, sources and sales stages. Leadership may only need to see how much pipeline sits at each stage and whether that distribution changed since the previous reporting period.
Canvas gives the person building the report another way to expose those answers without changing the underlying data model.
It also allows different operational workflows to stay closer to the reporting environment. A marketing team managing campaign launches could build an interactive calendar over its existing launch data. An agency tracking accounts could create cards or visual status views rather than maintaining a second presentation manually.
Google has been making similar moves toward reducing the distance between data and decisions across its products, including expanded conversion reporting through the Google Analytics Data API.
The pattern is becoming clear. Google does not only want its products to store and report data. It increasingly wants Gemini to interpret how that information should be organized for the task at hand.
Sheets Canvas Is Still an Early-Access Feature
There is an important limitation to the announcement: Sheets Canvas is not yet a universal Google Sheets feature.
Google's current support documentation says Canvas is available in English and is part of Gemini Beta for eligible work and school accounts, with administrator-controlled access. Personal access is limited to Google AI Pro and Ultra accounts, while some users can access it through Google's Workspace Experiments trusted-tester programme.
There are technical restrictions too.
Canvas is not currently supported in the Sheets mobile app. The spreadsheet needs to be stored in Google Drive, and Google says the feature may be unavailable when the relevant tab contains too much data. A canvas can currently use data from only one Sheet tab.
Those limits make the current version more suitable for controlled reporting and workflow experiments than for replacing an organization's entire business-intelligence stack.
For marketers, the practical implication is narrower but still meaningful. Teams already using Google Sheets as an intermediate reporting layer can test Canvas on contained datasets such as campaign summaries, content calendars, lead pipelines or monthly KPI tables. It can reduce the amount of manual presentation work required to make those datasets understandable to non-analysts, while keeping the underlying spreadsheet available for deeper investigation.
Google Sheets is not abandoning the grid. Canvas is giving users a way to hide it when the grid is not the best way to communicate the answer.
For now, access remains tied to Google's early Gemini programmes and eligible AI subscriptions. The spreadsheet underneath may look familiar, but Google is increasingly treating the interface above it as something Gemini can build on demand.