
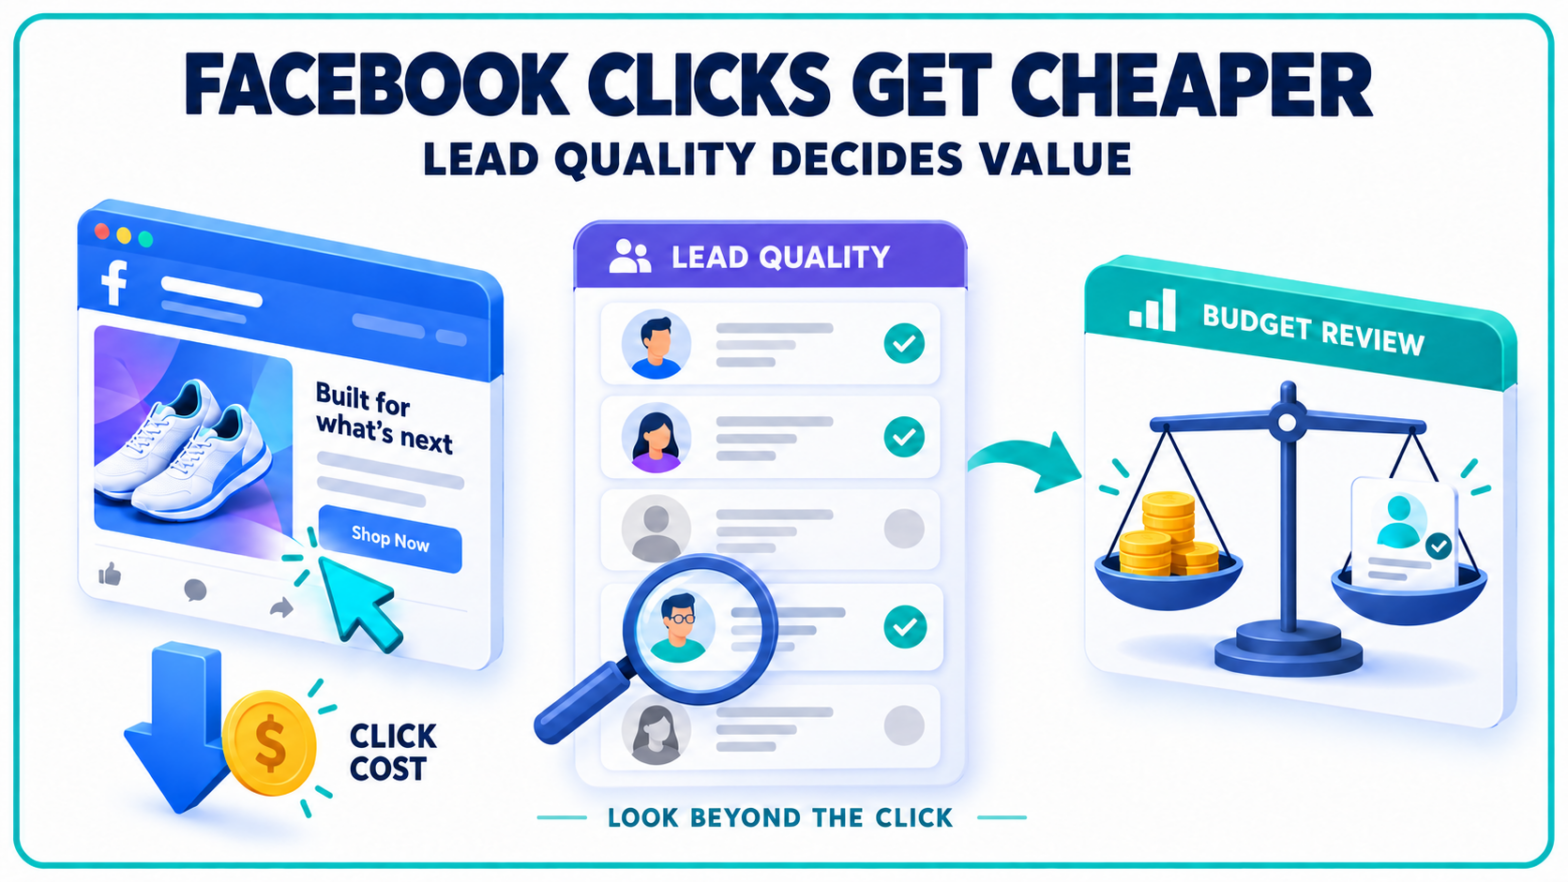
Facebook clicks are getting cheaper. The cost of generating a lead has barely moved, leaving advertisers with a more complicated budget decision than the headline decline suggests.
WordStream by LocaliQ’s 2026 benchmarks show stronger engagement and lower click costs across traffic and lead campaigns. The clearest improvement is in buying website traffic; the evidence for cheaper customer acquisition stops earlier in the sales process.
For businesses comparing Meta Ads with other channels, that distinction determines whether the report supports a larger test budget or a change in the wider media mix.
Facebook Ads Benchmarks Show Two Different Cost Stories
The original benchmark report separates traffic campaigns from campaigns optimized for leads. Its headline figures are medians, despite being described as averages, and all costs are in US dollars.
|
Campaign objective |
Metric |
2026 benchmark |
Reported annual change |
|
Traffic |
Click-through rate |
1.93% |
Up 12.87% |
|
Traffic |
Cost per click |
US$0.60 |
Down 14.29% |
|
Leads |
Click-through rate |
2.70% |
Up 4.25% |
|
Leads |
Cost per click |
US$1.80 |
Down 6.25% |
|
Leads |
Conversion rate |
8.54% |
Conflicting wording in report |
|
Leads |
Cost per lead |
US$27.39 |
Down 0.98% |
The traffic results show advertisers attracting clicks more frequently while paying less for them. Lead campaigns also recorded cheaper clicks, but their cost per lead remained effectively flat.
Those outcomes belong to different campaign objectives. A traffic campaign’s lower CPC cannot be substituted for the cost of acquiring a lead, booking or customer.
Businesses using Facebook ads to generate enquiries still have to account for what happens after the click. A successful form submission starts a sales process; it does not establish that the person is qualified or ready to buy.
Meta Ads Lead Quality Remains Outside the Headline Cost
A cost-per-lead figure measures the expense of generating the action counted as a lead. It does not reveal how many contacts answer a follow-up call, attend an appointment or become customers.
The platforms themselves distinguish between these stages.
Meta has described connecting customer relationship management systems through its Conversions API and lead optimization tools so that campaign delivery can use information about lead quality. Its explanation separates generating a contact from identifying a contact more likely to convert.
That distinction matters even when the initial lead price looks favourable.
Consider a hypothetical campaign producing leads at US$20 each, with one in five meeting the business’s qualification criteria. Its cost per qualified lead is US$100. Another campaign producing US$30 leads, half of which qualify, delivers a qualified lead for US$60.
The cheaper initial lead is more expensive at the next stage.
Google’s qualified and converted lead definitions make a similar separation. Qualification can happen in a CRM outside the advertising platform, while a converted lead represents a later business-defined milestone, such as a completed sale.
Comparable budget decisions require comparable milestones.
Paid Search Buys a Different Starting Point
A lower social CPC does not establish that the same money would produce more customers if removed from search.
Google’s Search campaign documentation describes reaching people actively searching for products or services. Keywords connect the advertisement with an expressed request. Social advertising can introduce an offer before that person has made a corresponding search.
Both interactions can contribute to a sale, but they begin from different circumstances.
A person searching for a specific repair service today and someone clicking a maintenance offer while browsing a feed may require different follow-up and different amounts of time before booking. Their click prices alone cannot measure the value of those interactions.
Campaign settings add another distinction. Google supports bidding towards clicks, conversions or conversion value, depending on the advertiser’s goal. The choice changes the outcome its delivery system pursues, even within the same channel.
That is why paid search comparisons need to begin with the business objective. A traffic campaign and a qualified-lead campaign are not asking their respective systems to do the same work.
The benchmark provides a reference for current campaign economics. It does not measure what happens when an individual advertiser takes its next dollar out of one channel and places it in another.
Industry Results Resist a Universal Budget Shift
The overall decline also conceals substantial differences between business categories.
Traffic CPC rose 73.53% for Shopping, Collectibles and Gifts and 43.90% for Sports and Recreation. In lead campaigns, the reported cost per lead ranged from US$13.74 for Real Estate to US$61.56 for Dentists and Dental Services.
An advertiser’s industry can therefore change the comparison considerably.
For marketers, the practical implication is to evaluate a defined Meta test against the existing channel mix using the same qualification rules, reporting period and customer-value measures. Cost per qualified lead, appointment attendance and completed sales provide a stronger basis for reallocating spend than CPC alone. Creative, offers and follow-up capacity also need to be recorded so changes in results can be interpreted.
The report does not establish that any particular platform feature caused its observed improvements.
The Dataset Has Limits Beyond Its US Sample
The methodology lists 1,377 traffic campaigns and 452 lead campaigns, all US-based. Industry subcategories can contain as few as 11 traffic campaigns or four lead campaigns. These are sample benchmarks, not Canadian market rates or a census of Meta advertising.
Two publishing inconsistencies require caution.
The introduction describes an almost 11% improvement in lead conversion rate, while the dedicated conversion-rate section describes a 0.98% decline. The methodology also gives June 30, 2028 as the end of the lead-campaign observation period, an apparent error in a report published in 2026.
The traffic observation window is stated as April 1, 2025 to June 30, 2026. The correct lead-sample end date and the conflicting conversion-rate comparison remain unresolved in the published text.