
On August 3, Deep Aujla, Analytics Program Manager at Google, announced that a Google analytics demo account of the Google Merchandise store was made publicly available.

The newly offered demo account is a great resource for analytics newbies to learn through practical experience by using a fully functional analytics account. The new demo account includes data from the Google Merchandise Store that sells Google, YouTube and Android branded apparel, bags, and office supplies.
Most major analytics features that we normally implement on E Commerce stores, like Adwords linking, Goals and Enhanced ECommerce are included in the demo account, and webmasters now have a unique opportunity to gain practical knowledge on a fully functioning Ecommerce store.
Today, I’m going to show you how all the features and reports that are available in Enhanced Ecommerce tracking in the demo account.
First off : you can see exactly how Google has setup their Enhanced Ecommerce tracking in Admin > Ecommerce Settings

Conversions > Goals > Funnel Visualization
One of the most important steps in setting up analytics on your store is setting up goals for tracking your checkout funnel. Checkout funnels ( Conversions > Goals > Funnel Visualization ) show you the journey of visitors through the funnel you’ve set up so that you can improve those steps and increase conversion rates.
If you’d like to see how Google has setup their checkout funnels and goals, you can see it in Admin > Goals section

You can take a peek into the Goal setup, descriptions or details and see how they’ve set it all up.
All the Enhanced Ecommerce checkout steps were setup on August 2, and this is visible from the annotations.

The Enhanced ecommerce section in GA (introduced recently) has 10 reports in all to analyze product performance for both individual products and product categories. They also give a lot of insight into your customer's’ shopping and purchasing behaviors.
1. Ecommerce Overview:
This is where you can see a summary of all the transactions that occur on your store. It gives you an idea of the net revenue, net conversion rate, the number of transactions, and other details like average order value, campaigns, order coupon codes and affiliation details.
It also shows you the top selling product categories and brands, so that you can choose which items to use for, say, internal campaigns and other promotions to boost conversions.

From a quick look at the best selling products list, I notice that drinkware is a bestselling product category.
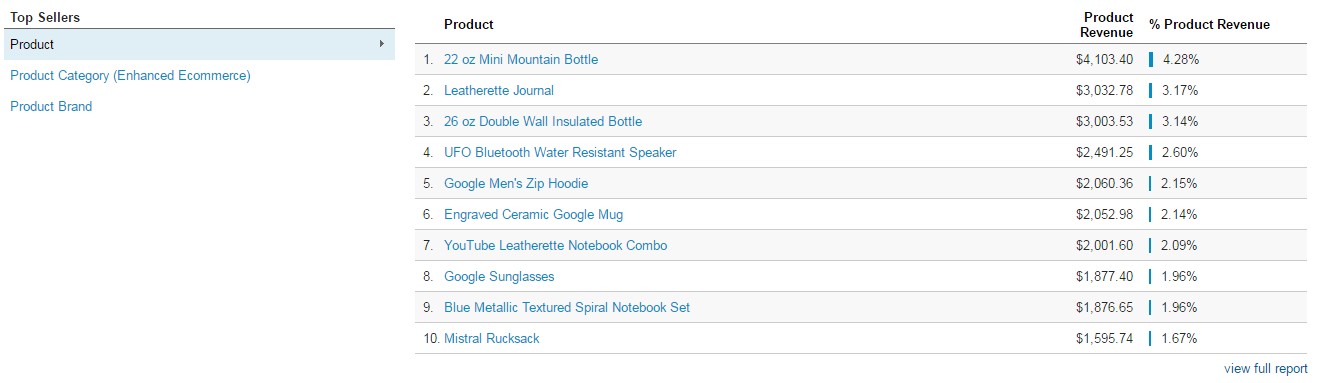
Now we know what to promote or run a campaign on, don’t we?
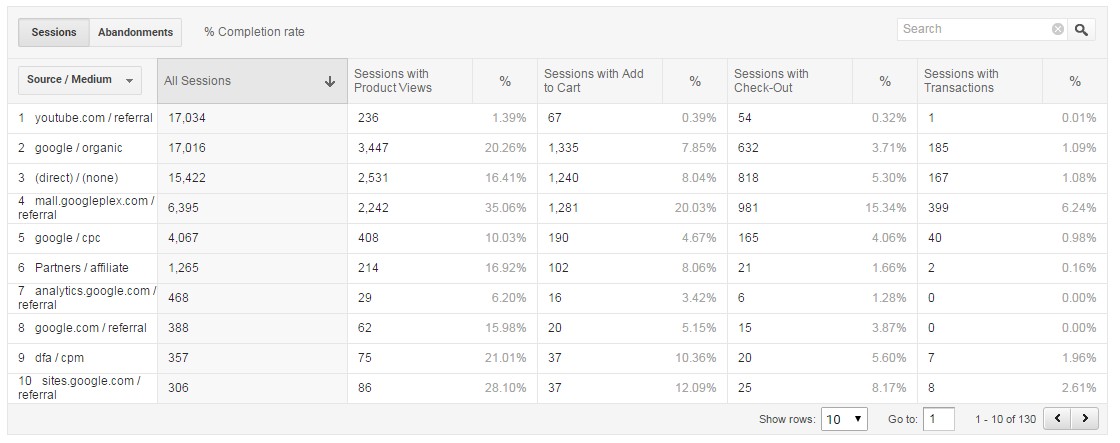
2. Shopping Behavior:
The Shopping Behavior report can be accessed from Conversions > Ecommerce > Shopping Analysis.
This report shows you a detailed breakdown of the journey of your customers from when they enter your store to when they make a transaction.

Tip: If there is an abrupt drop in sessions in any of these steps, it’s an indication that there is some issue there that is hindering conversion.
Also, you can set the dimension as browser, campaign, city, country, source, etc., in the tabular report below the graph.
A quick look by setting the dimension as Source/Medium shows me that most of the conversions of the Google Merchandise store occur through email marketing, and that it converts much better too at 6.24% , better than organic (1.09%) and direct (1.08%).
3. Checkout Behavior Analysis:
The checkout behavior analysis report shows you how users progress through your checkout processes, including billing and shipping, payment, and review. Just like the shopping behavior report, a discrepancy in the flow might indicate that there is something wrong with one of the steps, say, a faulty payment gateway that causes a big drop in the Payment drop off step.

A quick look at the tabular report below using ‘Country’ as the dimension shows that while 44.03 % of customers from the Unites States and 31.86% of customers from Canada follow through to the payment step, the conversion rates for all other countries drops drastically.
Guess why?
It’s because the shipping country is to be chosen at the beginning before entering the store. When customers notice that store only ships to the US and Canada (since they’re in the US and Canada section of the site) in the checkout page, it turns them away.
4. Product Performance:
With the product performance report you can see how well a product is converting based on the number of times it was seen and how many times it was added to the shopping cart.
You can get both sales performance insights and shopping behavior insights from this report.
The sales performance insights detail metrics like net revenues earned from a product, number of purchases, the average price, quantity etc.
The shopping behaviour insights detail the car-to-detail rate (percentage of customers who added the product to their cart after seeing the product detail pages) and the buy-to-detail rate (percentage of customers who bought the the product after seeing the product detail pages).
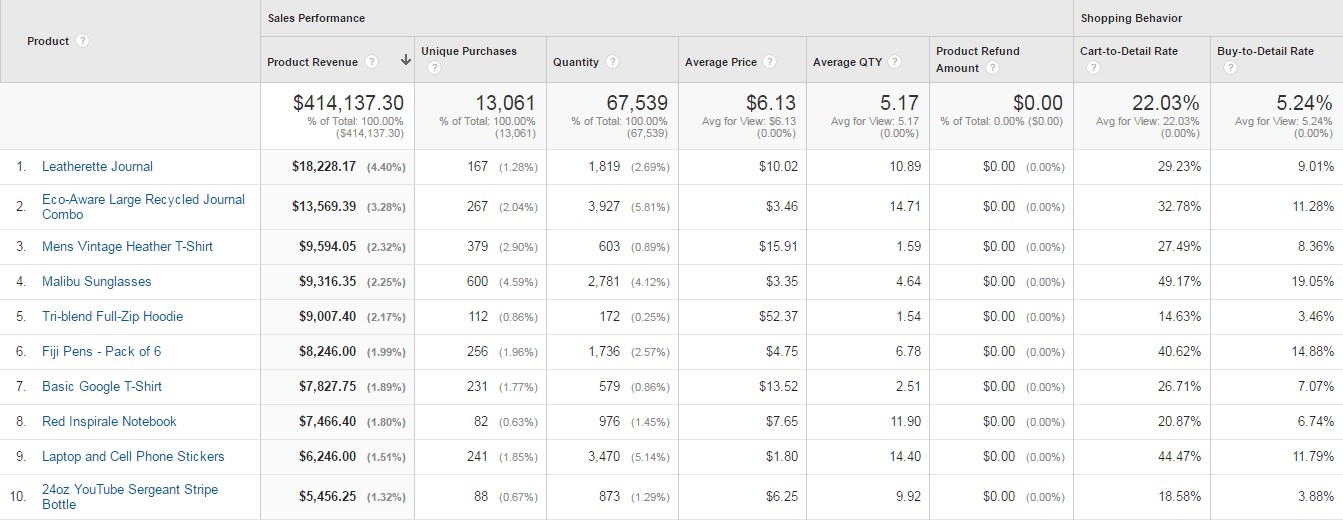
This section is invaluable as it shows the cart-to-purchase flow, and enables you to identify any issues.
Discrepancy in product shipping details is one of the primary reasons for large differences between the Cart-to-Detail and Buy-to-Detail rates.
5. Sales Performance:
The Sales Performance report lets you analyse transactions by ID and date (where you can group transactions by date).
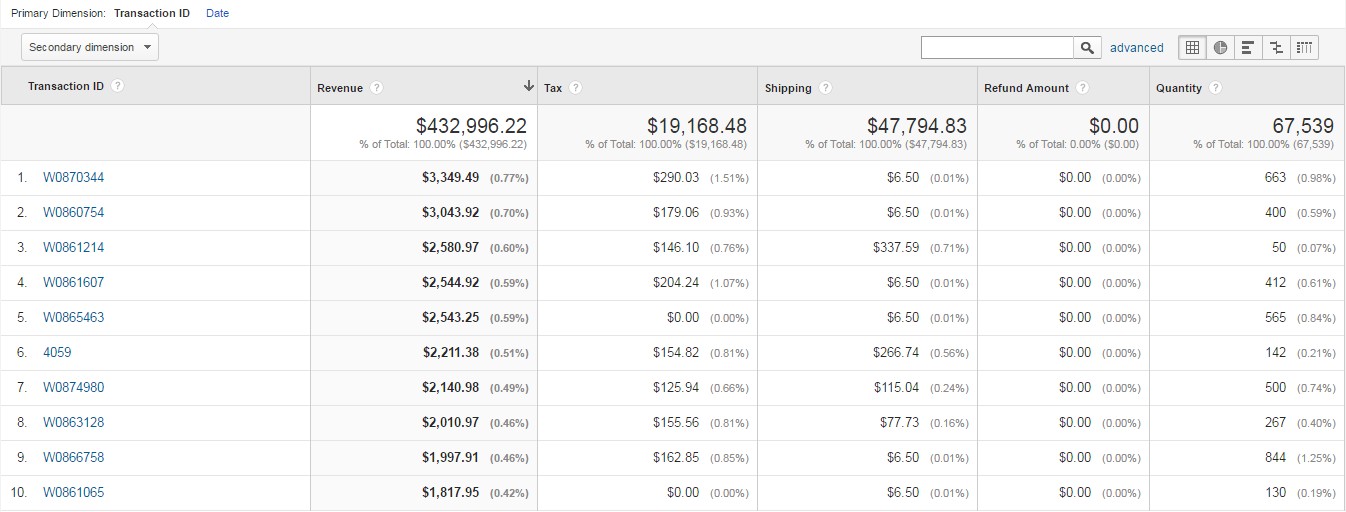
The newly introduced Refund Amount column lists the refunds that have might occurred for the transactions. The refunds can be tracked with the transactions IDs even if they occurred on another day.
It looks like there aren’t any refunds for any of the transactions in the Google merchandise store.
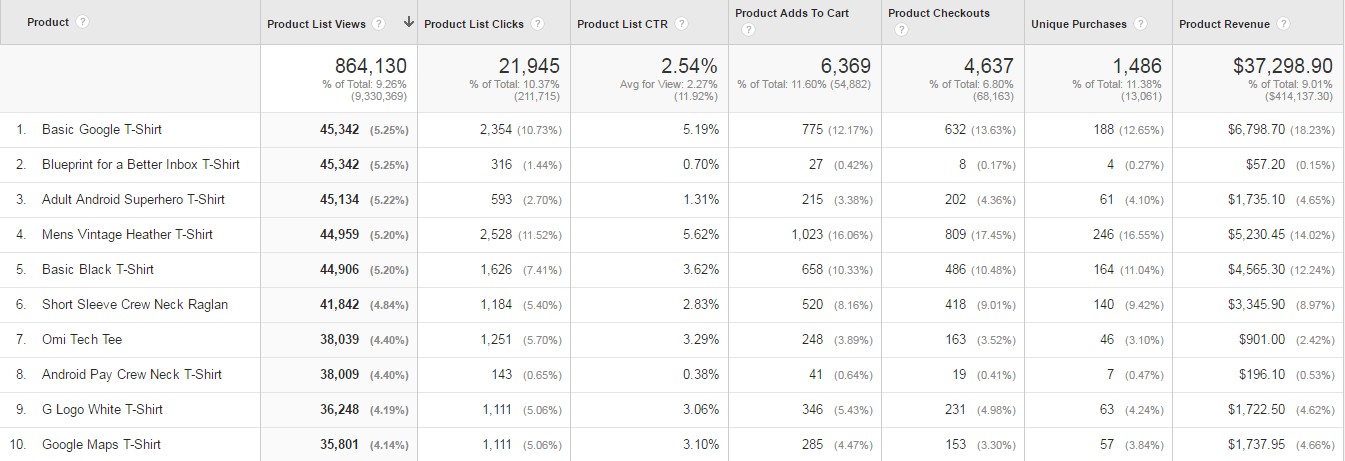
6. Product List Performance:
The Product List Performance report is right below the Sales Performance Report.
While the Product performance report can be used to analyse how well individual products are performing, the Product List Performance report can be used to analyse how product lists are performing, i.e. you can see how well products performed when they’re shown in groups or lists.
Product lists can be of several types:
Search results:
These are all the products that are shown together when you use the internal searching feature of your Ecommerce store. These can be products from the same and related categories, and of different brands.
Usual category lists:
This is when you choose to see products from a particular category, for example, Men's T-shirts and Men's Outerwear.
On the Google merchandise store, some examples of product lists are YouTube, drinkware, Android, bags, etc.
Related Products:
This is the product list that we’re most familiar with- the products that are shown below “You might be also interested in” or “Customers who purchased this product also liked” sections in product detail pages.
From a quick look at the product lists on the Merchandise account, I can see that Men's T-shirts convert best.
On clicking Men's T-Shirts, I can also see the best selling products in this list. Now I can decide which products to display prominently in this list, and which product pages to consider for improvement.
Insights from the Product List report can be used for
- Understanding which products sell better as upsells and downsells
- Which products are best suited to be included in other product lists (for example: By discovering the best selling products within a core category, we can decide which products to display as Related products)
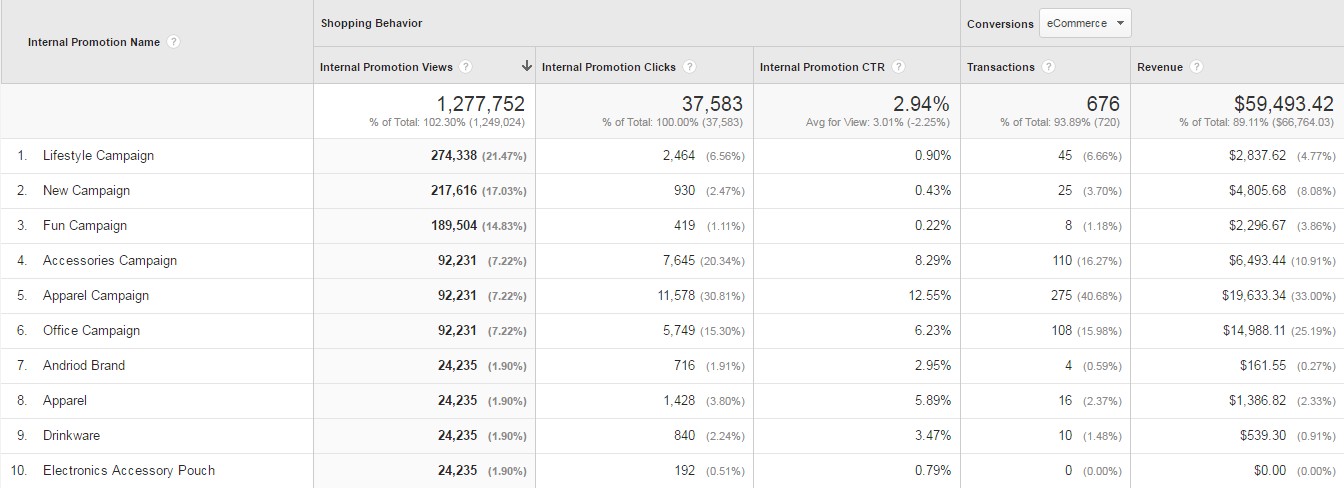
7. Internal Promotions:
Internal promotions are simply the in-site advertising you use to drive traffic from one section of your site to another.
The report can be accessed from Conversions > Ecommerce > Marketing
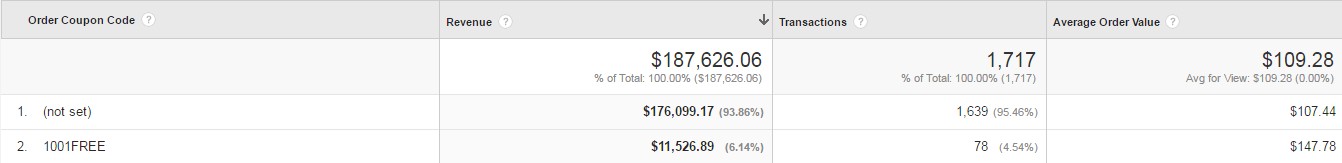
8. Order Coupon:
The Order Coupon Report simply shows you the performance of order-level coupons ( or coupons applied on orders as a whole). It lists the revenue generated by each coupon, the transactions and the average order value.
Looks like there are no active order-level coupons on the Google Merchandise store. However, the order coupon 1001FREE managed to bring in $11,526 in revenue in December last year.
9. Product Coupon:
The Product Coupon Report simply gives you insights on the performance of product-level coupons (or coupons applied on a particular product). It lists the revenue generated by each coupon, the transactions and the average order value.
No product coupon codes transactions have been tracked so far here.
10. Affiliate Code:
In the Affiliate Code report you can see how affiliates drove traffic and revenue to your site. The report shows net revenue, transactions and the average order value.
This is invaluable if you have an active affiliate program on your store. You can see which affiliates are sending quality traffic that drives sales and revenue.
Apart from these great reports, there is a lot more data available in the demo account including Adwords integrated reports and content groupings. You can get demo access to take a look here.
Happy analyzing!


