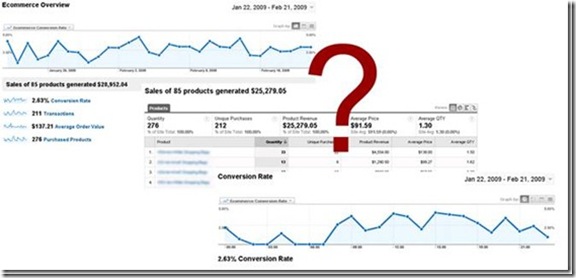
The wealth of detailed information that Google Analytics can provide is impressive. There are hundreds of ways of charting and displaying metric data. But lets face it, website marketing strategists and/or business owners, whilst being wowed with the information need to know what to look at.
As analytics experts, we need to evaluate and understand the customers true indicators of performance and reorganize the sometimes overwhelming metric data sets into a clear format so our customers can make smart business decisions!
One of the things that I like to do to measure campaign performance is a metric called Return On Advertising Spend (ROAS).
Also on TechWyse:
The True SEO Metrics That Indicate Success
Social Media Advertising Predictions For 2015 And Beyond
What is Return On Advertising Spend?
ROAS differs from Return on Investment (ROI). Return on investment measures the total margin that the total operation nets. This includes all operation costs rather than just advertising expenditure. ROAS measures how much revenue you are making for every dollar you spend on advertising. It offers the direct result of each advertising dollar you spend and answers that all important question:
“How much is my advertising making me?”
Try answering that question with traditional print advertising!
ROAS in Action
A proper ecommerce setup using Google Analytics offers an optimal environment for measuring ROAS. A correctly configured installation pulls actual sales data from the online receipt page into analytics. This provides huge amounts of valuable reporting. For example, linking traffic sources to revenue, a great subject for another day!
This amount of data is nothing short of confusing for a business executive and they don’t have the time to waste getting to grips with detailed information.
What we really need to do is filter this analytical data into something relevant to the decision maker and manipulate it into more meaningful representations so that business decisions can be made.
We like to call these ‘scorecards.’
Create an ROAS Scorecard
Here is how to create a ‘scorecard’ for the ROAS metric:
- Open the Google Analytics Custom Reports tool, create a new report
- Add the ‘COST’ and ‘REVENUE’ metrics and the ‘MONTH’ dimension, title your report and create
- Change the dates to your required date range
- Export this data as a CSV file
- Open the CSV file, create the ROAS measurement by dividing revenue by cost and add an optional % change so see trending.
- Sit back and admire.
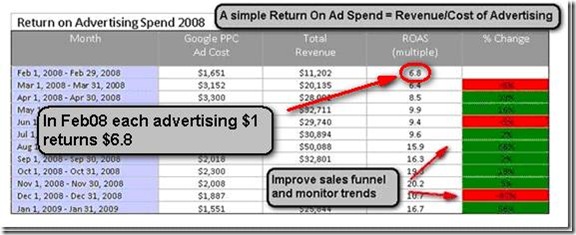
The return on advertising spend scorecard below was useful for examining the level of spend to budget for the 2009 online campaign as well as measuring fruitful sales funnel improvements made in July for this seasonal based ecommerce business.
These figures may not be completely accurate figure from a bookkeeping perspective but it provides a simple and replicable measurement that can be monitored over time. Return on advertising spend is vital when making user experience and advertising campaign changes and understanding how they affect your bottom line!


on
Hi Matt…. defining a sustainable or target ROAS really depends on your margin or ROI.
On low margin products even an amazing ROAS might not make the necessary margin to support the business model.
I suggest pulling a table together of UNIT COST/UNIT ADVERTISING COST/REVENUE/MARGIN/ROAS/ROI; and then varying ad spend accordingly to see what works. Define the ROAS target…..test and cut anything that is not at the required level.
Hope that helps!
Jon 🙂
on
My question on ROAS is what is a "good" number. The number I was given by our tech people is 300-500%, and b/c right now our number is so much higher than that, they are saying we are doing great, but our is a VERY niche business and so what is a good number for a market with only a few players vs. a good number for mass players?
on
Hey Ryan!
Thanks for the comment. In a simple world where we are comparing the static hypothetical situation you suggest, then the answer IS relatively simple. However, if you combine your suggested situations (and add 5-10 more) then ROAS plays a part in understanding budget allocation. For example, your customer wishes to add $500 to their spend… then my suggestion would be to initially place it in situation 1 see if you can maintain the 1000x return and generate $500K. If you place this in situation 2 then you might expect $5000 in additional revenue.
When we manage multiple campaigns we trend the ROAS for each over time to understand how effective they are being.
Really we use ROAS is an alternative to ROI because we do not have the full understanding of customers total investment (including full operational costs etc).
I hope this helps.. thanks for your post!
Jon
on
I'm sorry to come late to this conversation. I found this post because I am currently doing some SEM work for a company that really likes to use the metric (ROAS) and I wanted to find out why anyone would use this metric. In my opinion, it is completely useless. Maximizing ROAS does not necessarily lead to maximizing profit. There are much better ways to use your Revenue and Cost numbers to maximize profit. What about Revenue – Cost. I think businesses would be much rather know that number.
Hypothetical situation 1:
Revenue = $1,000.00
Cost = $1.00
ROAS = 1000
Profit = $999.00
Hypothetical situation 2:
Revenue =$10,000.00
Cost = $1,000.00
ROAS = 10
Profit = $9,000.00
Which of these situations would you rather be in? If you answered 1, you should probably find a new career.
on
David – Bang on…. measure and make intelligent decisions. Any marketing budget should be measured and tuned for maximum effect.
Mia – Thanks for the comment. I understand your reservations. Please let me clarify.
Obviously,operational vs revenue is essential for understanding ‘Business Effectiveness’ and how profitable one’s business model is.
For the purpose of specifically measuring ‘Ad Campaign Effectiveness’ operational costs introduce too many variables that clutter the effect of campaign tuning. If I’m deciding whether to adjust spend on Google Adwords or the effect of recent content changes then I do not need to see my facilities or resource costs built into this. In fact their inclusion would remove the abilibty to measure effectively.
It takes 2 minutes to create a ROAS report using analytics and gives you a simple reference point from which to tune.
Hype is irrelevant, ROAS is simply a measurement. The ‘new improved’ tape measures may be hyped but the inch is just there to measure with. The inch has no flaws unless you measure incorrectly with it! 🙂
Really, the point of this post is to say: “To get the best from your advertising dollar 1) Measure, 2) Present data in a format that allow decisions on ad campaign to be made and 3) measure the effect. Then repeat.”
on
Companies need to exercise utmost caution while spending money on advertising. It could help you scale up your sales or it could be a mere waste of money. Either way, one needs to keep a tab on the money spent on ads. Yes, Google Analytics is an extremely useful tool to measure your ROAS and can help you judge the pros and cons on your adspends.
on
I am not fully convinced about this much hyped ROAS. Yeah, I agree, it measures whether we are making more money than you are spending, but there is more to it. It’s fine, providing an initial indication of the status of our overall program and perhaps individual campaigns. But ROAS has a number of defects and even flaws, and I am not a big supporter of it. I think we need to see more about the operational costs of revenue vs expense.